GIS, 9 March 2017 - The Department of Disaster Management (DDM) has noted changes in weather patterns across the Territory when compared to historical data.
According to data published on the World Bank Group Climate Change Knowledge Portal, the average temperatures for the British Virgin Islands for the period 1900 to 2012 was a high of 78.26 degrees Fahrenheit for August and September and a low of 73.04 degrees Fahrenheit for January and February.
Director of the Department of Disaster Management, Sharleen DaBreo said that data recorded by weather stations during 2016 indicate that January is still the coolest month in the BVI with an average temperature of 72 degrees Fahrenheit and September remains one of the hottest months with a high of 93 degrees Fahrenheit.
She added, ‘While the coolest and hottest months remain the same, we have noted that the temperatures for 2016 were cooler (1.04 degrees lower) and hotter (15 degrees higher than average) when compared with the figures from the historical data”.
Ms. DaBreo further explained, “The analysis of 2016 figures was conducted and when compared to previous data, there was some validity in the recent observations and perception by some members of the public who believe the temperatures are either cooler or hotter than normal at certain times of the year”.
In terms of rainfall data, the Director said significant variations were noted in the figures collected in 2016 when compared to the averages for the period 1900-2012, including a shift in the driest and wettest months.
The BVI’s average lowest and highest rainfall months according to the World Bank Group Climate Change Knowledge Portal, are March and September with 2.83 inches and 10.73 inches of rain respectively.
However, in 2016 changes in the rainfall patterns were experienced as June became the driest month with no rainfall recorded and November became the rainiest month as 6.28 inches of rain was recorded.
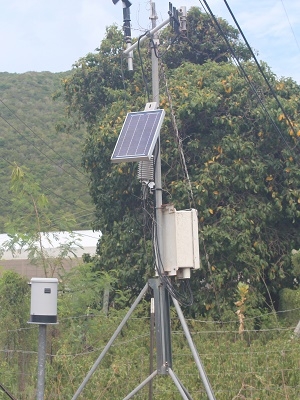
The Department of Disaster Management is not an official Meteorological Office; however weather related data is collected by the department to guide our decision making process and to highlight changes over a period of time.
*************************
DISCLAIMER
This article was posted in its entirety as received by SKNVibes.com. This media house does not correct any spelling or grammatical error within press releases and commentaries. The views expressed therein are not necessarily those of SKNVibes.com, its sponsors or advertisers